Polar plot app for easy detection of non-uniform combustion in gas turbines
CerTa Veritas has expanded its data-analysis tool MagicCorr with a powerful new feature: a polar plot for simultaneous visualization of comparable process variables.
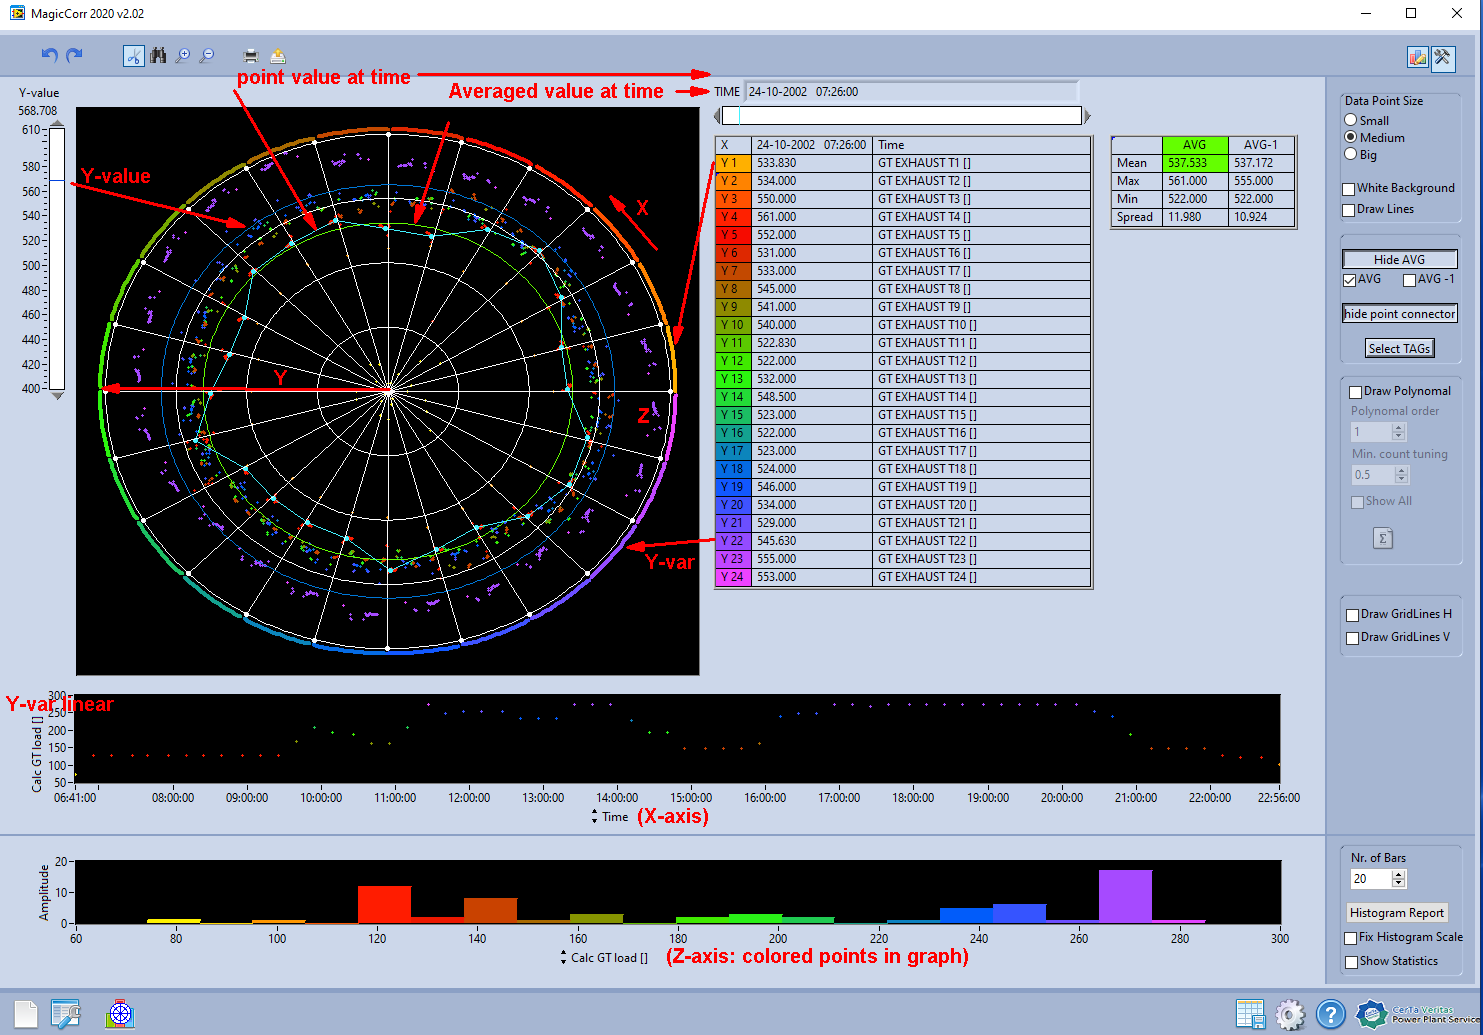
This new functionality allows users to display, for example, the complete evolution of 24 exhaust gas temperatures of a gas turbine over the course of a full day in a single graph. With the integrated time-selection slider, operators can easily focus on specific moments of interest. The corresponding data points can be connected by lines, providing an immediate overview of uniformity, or irregularity, across all measurements.
For power plant operators and gas turbine service providers, this tool offers a clear advantage:
Rapid detection of non-uniform combustion
Condition-based maintenance opportunities
Support for combustion tuning to optimize performance and extend expander lifetime
With this new feature, MagicCorr becomes an even more valuable solution for analysing, diagnosing, and optimizing gas turbine operation.
